
In brief
Business reporting is increasingly using infographics. This is particularly true when it comes to conducting and reporting lean market research. Infographics stand for an elegant and highly digestible way in presenting facts and outcomes of a study. It’s highly recommended to be used for business reporting and market research deliverables because of the high success that it brings to the concerned reports where it’s embedded. This post is about The Ultimate Guide to Infographics using Canva for Lean Market Research.
This post provides a practical guide to how to leverage the power of infographics for lean market research using tools like Canva.
Reporting infographics with Canva

Let’s start The Guide to Infographics using Canva for Lean Market Research by presenting Canva:
Canva is a freemium infographics SaaS solution.
It targets designers and non designers aiming at producing professional looking content with few clicks.
Its main differentiators are : User friendliness and the templates feature that we will take a look at in this section.
Canva can be used for reports, slides, thumbnails, logos, social media graphics etc.
Let’s take a look then at some functional features of Canva:
Canva basics
Background

Backgrounds are The initial design page sitting behind any design.
They are White by Default.
Backgrounds Can be changed into a color, image, texture etc.
Layers

Comes then the layers in Canva.
Layers in Canva stands for The different layers at which different graphical elements can be located.
Layers in Canva Can be used for building creative effects.
Add / manipulate media files

Photos, charts, videos etc can be added to your work.
They can be then arranged based on the design needs..
Group and ungroup
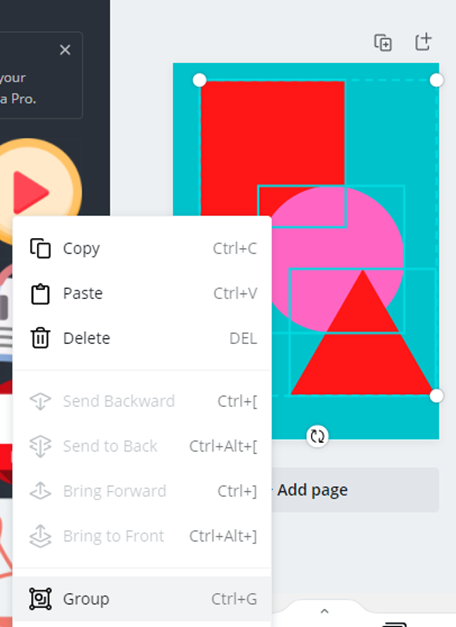
Comes then the Group and ungroup feature.
Group feature stands for Unifying initially different elements into one single element.
This feature Simplifies the usage afterwards.
The Ungroup feature stands for Separating initially unified elements.
This feature Can be useful particularly when deconstructing a pre-existing template or design.
Text

Comes then the Text feature in Canva.
The text feature is An independent option on the left tree of Canva.
The text feature Allows adding texts as headings, subheading, explanatory texts etc.
This feature is Particularly useful when generating Canva based full research reports since different types of texts should be added.
Frames and Grids
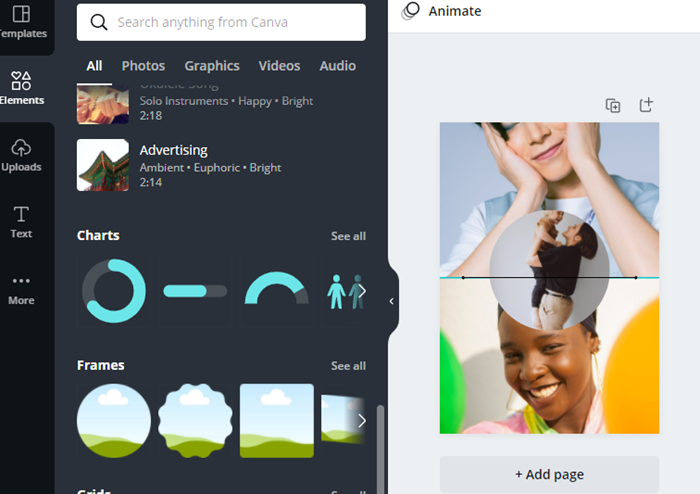
Comes then the frames and grids feature in Canva.
Frames and grids is A user friendly way for adding cleanly images and charts into the design.
This feature Pre-defines the global architecture of the design.
Different shapes & grades can be added to the Canva project.
Editing photos

Editing photos in Canva stands for Basic yet highly creative manipulations of photos for adding artistic dimension to the produced designs.
Templates

Comes then a major feature of Canva.
That is Templates.
Templates is One of the major differentiators of Canva as an online infographics solution.
Templates in Canva stand for Pre-defined designs that can be used for inspiration and more importantly as starting points for the design.
This feature Saves a lot of energy and time especially for non professional designers.
Templates in Canva Guarantee a professional result
Deconstructing a template

Creating a report

The Canva tools can be used for creating a highly professional lean market research report.
For this purpose, the following steps can be adopted in Canva:
- Create a new report
- Select the adequate template
- Deconstruct the template and adapt it to your target business DNA
- Build the report
Pros tips
Let’s take a look now at some pros tips for using infographics with Canva in preparing lean market research reports and deliverables:
- Canva is a great Infographic tool where the free plan is more than enough for getting started with
- Deconstructing templates and going through several ones is a great exercise for improving your infographic skills
- It takes decreasing time for creating a new design and reports since many steps are repeatable
- Infographics is a lot of fun but takes time and energy so it’s up to you to do it or delegate it
- Don’t hesitate to engage professional designers once the target DNA is clear enough and the business is well ignited
- Great infographic freelancers exist on Fiverr, Freelancer, Upwork etc

Very good article. I definitely love this site. Stick with it!
Thank you ! 🙂
Please stay tuned, a lot more is yet to come ! 😉